Crown Castle
Revamping Data Cleanup for Telecom Tower Equipment

Details:
Team:Product Manager, Developers, Drone Data Analysts and Senior Product Designer (me)
My Role:End-to-End Design Lead, User Research, Prototyping, Usability Testing, and Development Support
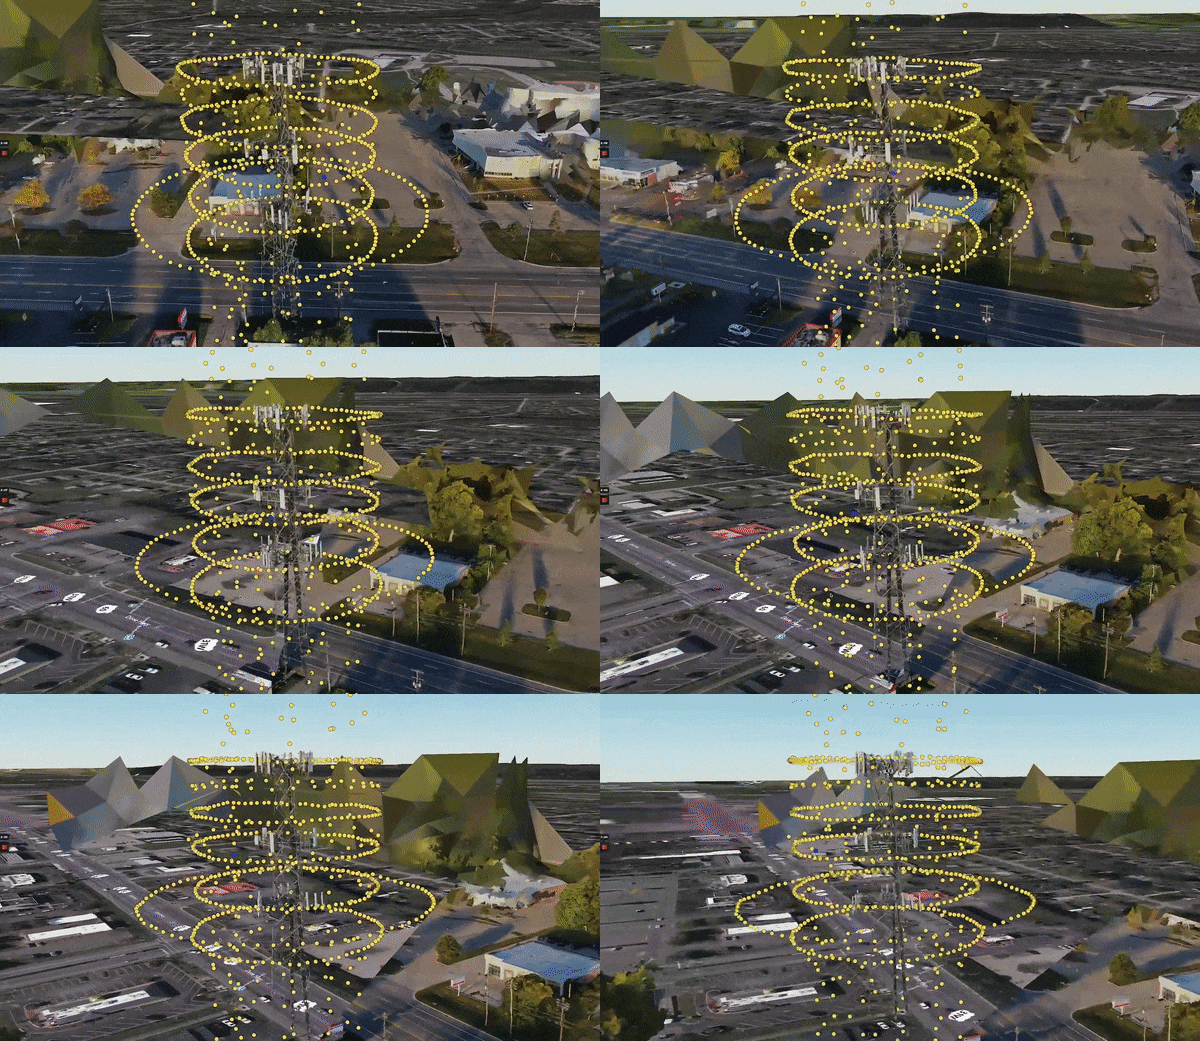
Managing over 40,000 cell towers across major U.S. markets requires accurate equipment data to maintain seamless operations.To improve telecom tower assessments, Crown Castle adopted drone technology equipped with high-resolution cameras and advanced sensors.
These drones capture precise visuals and generate detailed JSON readouts of antennas and other critical components, replacing time-consuming and error-prone manual inspections. However, a new tool was needed to enable users to efficiently update outdated data.
Roles & Responsibilities
As the Senior Product designer for the project, my responsibilities included:
- End-to-end design of the application, from concept to implementation.
- Collaborating with product managers, developers, and stakeholders to align on business goals.
- Designing an interface to compare legacy equipment data with drone-captured data.
- Conducting user research to gather requirements and define project objectives.
- Creating high-fidelity mockups and prototypes to refine and enhance the user experience.
- Using Figma’s Dev Mode to deliver design system specs and support developer implementation.
Problem Statement
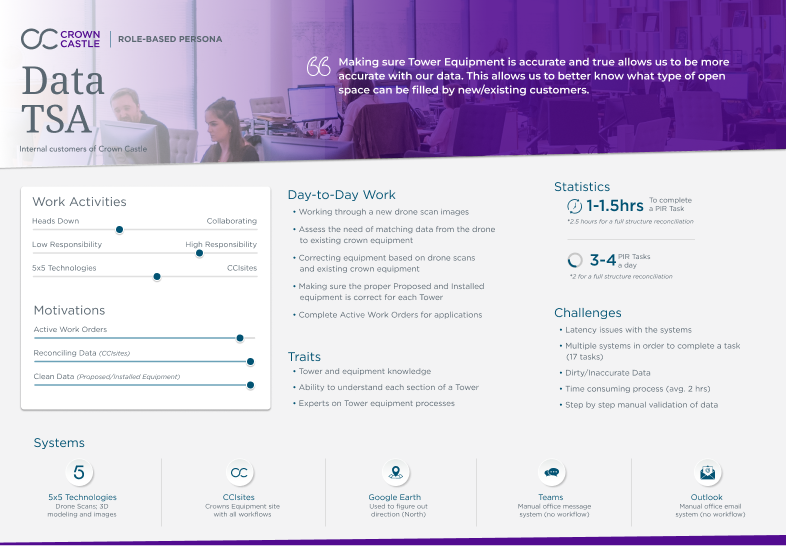
Managing outdated telecom tower equipment data was slow and error-prone due to a lack of modern tools and reliance on manual processes. Data TSA’s (Employees) struggled with juggling multiple browser tabs and spreadsheets, which led to delays, errors, and a lot frustration. A user-friendly “Single Pane of Glass” solution was urgently needed to address these challenges.
Problem Statement
Managing outdated telecom tower equipment data was inefficient and error-prone:
- The existing workflow lacked intuitive tools, relying on cumbersome manual processes.
- Employees had to juggle multiple browser tabs and spreadsheets to complete tasks.
- These inefficiencies caused delays, increased errors, and led to user frustration.
- A streamlined and user-friendly solution was urgently needed.
UX Research & Findings
PROCESSS
- Conducted interviews with 10 Data TSAs (employees responsible for data cleanup) to understand workflows and challenges.
- Observed users’ interactions with the existing system, identifying pain points and inefficiencies.
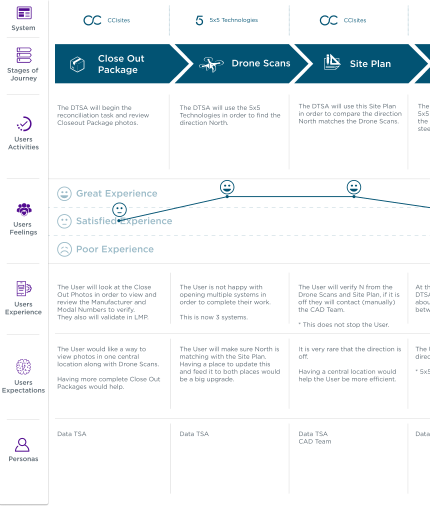
- Created user-based personas and journey maps detailing workflow steps.
Users faced significant challenges updating data due to inaccurate inspection readouts and
the need to switch between multiple datasets, browser tabs, and applications.
- 75% of users relied on external tools to manually compare datasets.
- Updating each tower required 20 separate steps and multiple browser tabs.
- Errors were frequent due to the “swivel chair” process of switching between tools and applications.
- Users needed better filtering options and a streamlined way to match old records with new drone flight data.

Design Process
IDEATION
Facilitated a brainstorming session with stakeholders to define must-have features, including:
- Side-by-side data comparison for easy identification of discrepancies.
- At-a-glance representation of drone flight data, including exact equipment positions.
- Quick editing capabilities for both drone and legacy data.
- Advanced filtering and error flagging to improve accuracy and efficiency.
PROTOTYPING
Developed a high-fidelity prototype that included:
- Built scalable design system from a customized Tailwind component library.
- Detailed card-style data showing equipment positions from drone data versus existing datasets.
- Drag-and-drop or click-to-click functionality for intuitive equipment card matching.
- Dynamic filters to narrow datasets by equipment type, structure, position, and other specifications.
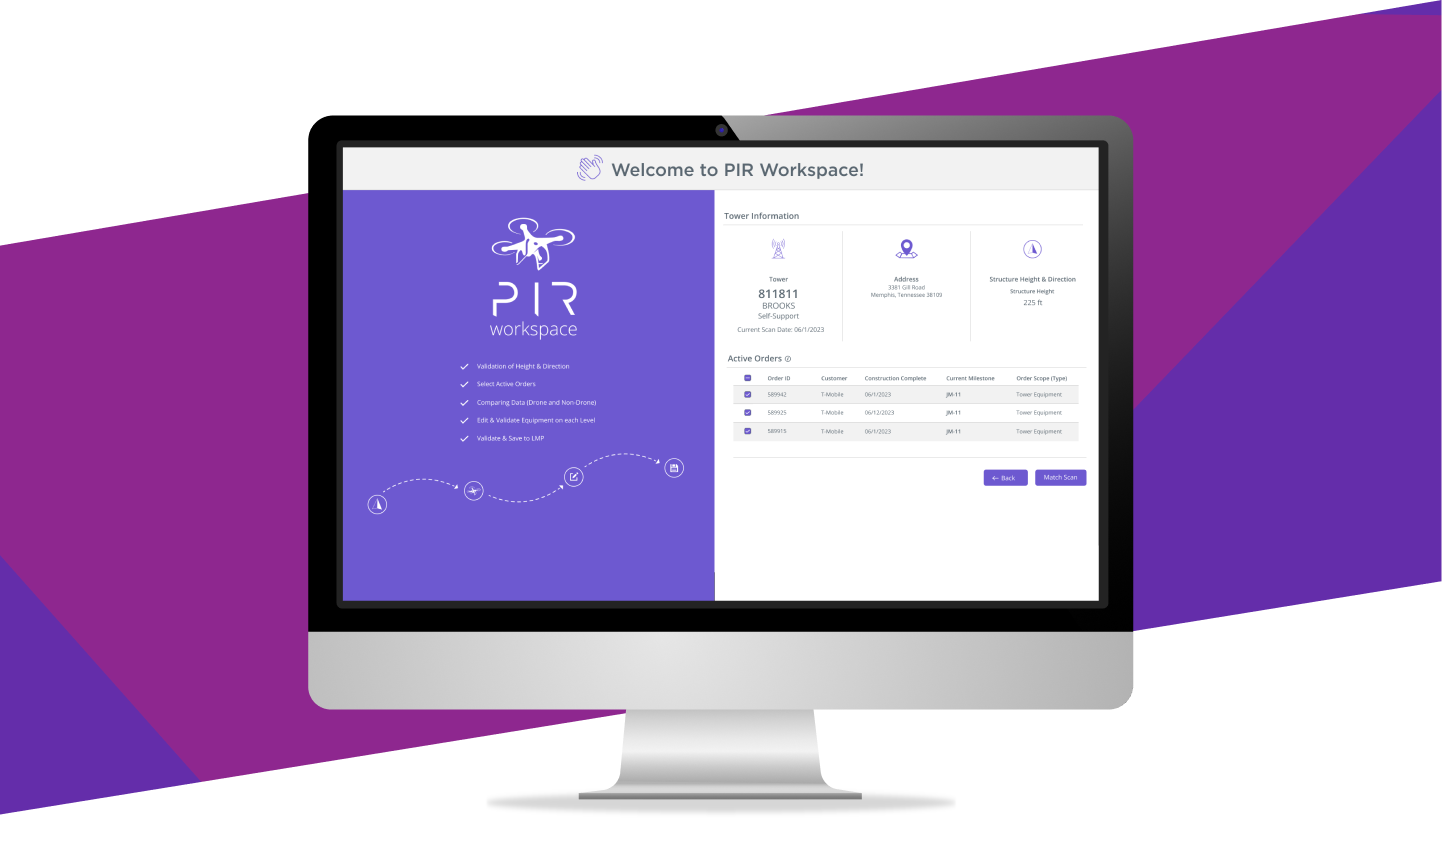
Equipment Matching
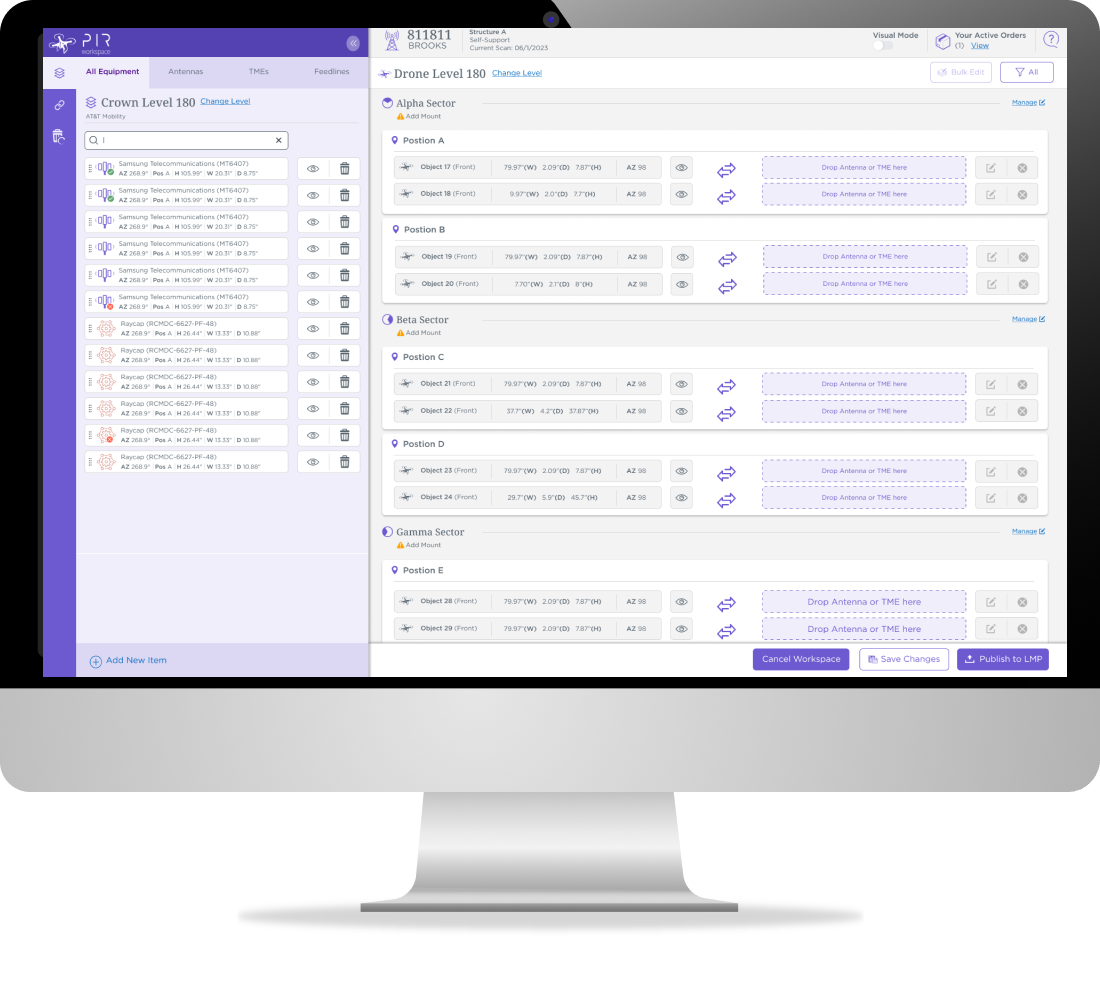

Edit Equipment
All equipment information can be edited through an intuitive slide-out panel.

The Solution
SIDE-BY-SIDE VIEW
- Displays legacy data on the left and drone-captured data on the right for efficient, “at-a-glance” visual comparison.
- Enables users to quickly scan and identify discrepancies between datasets.
MATCHING TOOL
- Click-to-click or drag-and-drop functionality tailored to accessibility needs.
- Automatic alignment suggestions and alerts based on equipment type and position.
- Tower rendering interface for visualizing exact equipment positions or a tabular (grid-style) interface for detailed data comparison.
FILTERS & FLAGS
- Advanced filters to narrow down datasets by equipment type, structure, or position.
- Alert tool to flag unclear or potentially mismatched items.
- Equipment status icons for quick identification of missing or misaligned components.
Completed Matching
The user successfully matched all equipment records with the corresponding drone data displayed on the right. It is now ready to be verified and published.


Quick View
Users can view key details at a glance, eliminating the need to open the full editing panel.

Ongoing Results & Impact
QUANTITATIVE RESULTS
- Data cleanup efficiency improved by 40%.
- Matching errors reduced by 30%.
- User satisfaction scores increased from 3.2 to 4.5 on a 5-point scale.
- Ongoing improvements observed as user feedback drives new feature additions.
QUALITATIVE IMPACT
- Users reported significantly reduced frustration and greater confidence in the system.
- The tool established a new standard for internal applications and inspired similar revamps in other workflows.
Alerts & Notifications
Upon save or publish, any errors or possible issues are highlighted in accessible colors. Additionally, the “Alerts” panel that allows users to quickly access issues on any level.
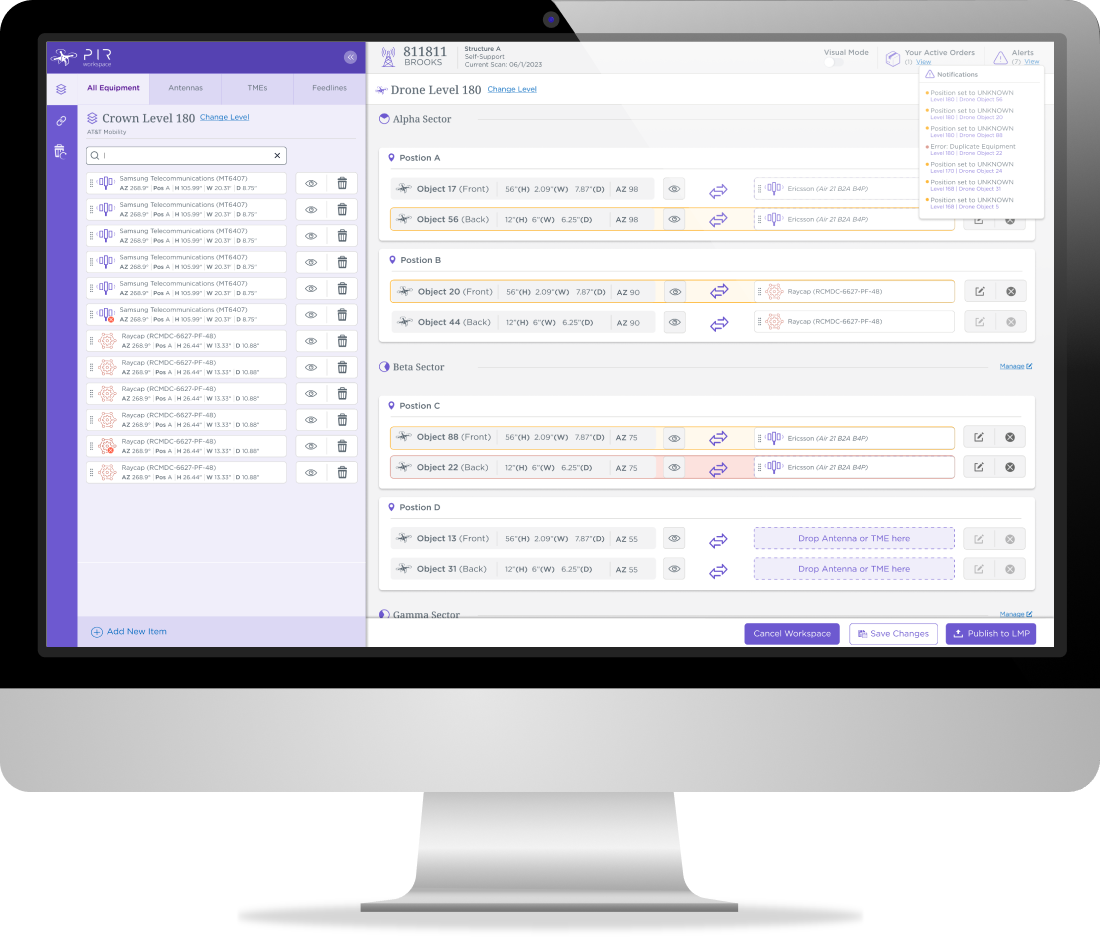

Visual Rendering
A secondary matching interface was designed to mirror the actual structure of the tower, giving users a clearer visual reference for the location of each piece of equipment.

Quick View
Similar to the other quick view, this interface displays matched data alongside the updated drone data for easy side-by-side comparison.

Reflections and Future Opportunities
One key takeaway was the importance of iterative feedback loops in continuously refining the solution. Looking ahead, there is potential to integrate machine learning for automated matching suggestions and expand the application to support on-site data validation through mobile devices.
This project not only addressed a critical operational challenge but also highlighted the power of thoughtful design in improving efficiency and user satisfaction.

- Prev
- Next
- Next


